Friday, October 19, 2007
The concept of form in cricket has predictive value, though its sign varies with the batsman.
One of Martin's suggested blog topics has been abandoned, taken up by me instead. He wondered, for instance, "If Ricky Ponting has averaged 80 in his last 5 innings does this mean he is more likely to score above his career average in the next innings?"
The answer in this specific case is "Yes", but the overall picture is much cloudier.
To study this problem I took the innings by innings list of various batsmen's Test careers, and modified it so that each "innings" actually meant the number of runs between dismissals. (I couldn't be bothered making my code airtight; if a batsman ended his career with a not out, that innings doesn't count). I then plotted the value of each innings (from the sixth innings onwards) against the average from the previous 5.
Below the cut are the resulting scatterplots, with three curves drawn on them. The blue curve is a least squares linear fit to the data. (Yes, I know that cricket innings aren't remotely nice as far as statistical distributions go, but it gives some indication nonetheless.) The red curve is the expected least squares fit for the batsman's innings in random order. I did this with a bit of Monte Carlo: shuffle the innings a hundred times, do a least squares fit for each one and take the average. The black curve is perhaps the most useful one.
Define 'lead-up form' as the average over the last five innings. The y-value of the black curve is then the average of all innings such that the lead-up form is greater than the x-value.
So it tells you what Ponting averages in his next innings, given that the average over the previous five was greater than, e.g., 80.


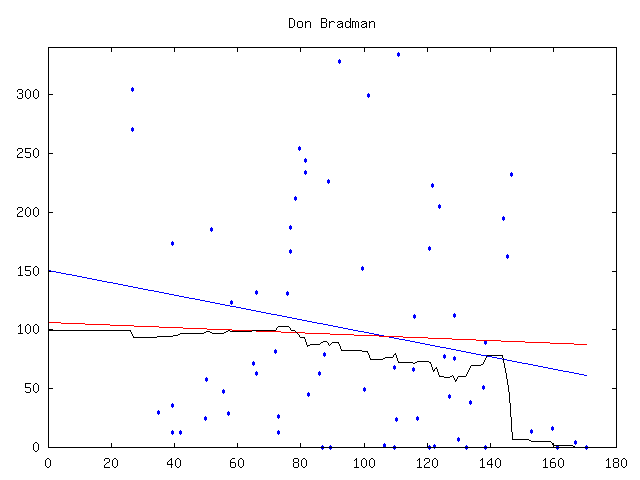
I'll restrict myself to a few comments. Justin Langer got most of his big scores after mediocre runs. The big drop-off at the high end of Greg Blewett's graph shows how inconsistent he was. When Greg Chappell's form was dynamite, it was really dynamite. When Bradman had a rut for five innings, England must have been very, very worried. Conversely, if he'd made 750 runs in his last five dismissals, they would have been confident that he was due for a low score.
Victor Trumper's is the most surprising for me.
Now that I've got the code working, it only takes a minute or two to make one of these graphs. So feel free to make requests, especially for players where the notion of form might be interesting.
I will also try using three innings rather than five to measure form, when I summon the energy to do so.
Edit added later: If you take all batsmen who average over 40, and scale each batsman's innings so that all of them average 40, and throw all of the data points onto the graph, the slope of the regression curve becomes a rather flat-looking 0.01.
The answer in this specific case is "Yes", but the overall picture is much cloudier.
To study this problem I took the innings by innings list of various batsmen's Test careers, and modified it so that each "innings" actually meant the number of runs between dismissals. (I couldn't be bothered making my code airtight; if a batsman ended his career with a not out, that innings doesn't count). I then plotted the value of each innings (from the sixth innings onwards) against the average from the previous 5.
Below the cut are the resulting scatterplots, with three curves drawn on them. The blue curve is a least squares linear fit to the data. (Yes, I know that cricket innings aren't remotely nice as far as statistical distributions go, but it gives some indication nonetheless.) The red curve is the expected least squares fit for the batsman's innings in random order. I did this with a bit of Monte Carlo: shuffle the innings a hundred times, do a least squares fit for each one and take the average. The black curve is perhaps the most useful one.
Define 'lead-up form' as the average over the last five innings. The y-value of the black curve is then the average of all innings such that the lead-up form is greater than the x-value.
So it tells you what Ponting averages in his next innings, given that the average over the previous five was greater than, e.g., 80.
I'll restrict myself to a few comments. Justin Langer got most of his big scores after mediocre runs. The big drop-off at the high end of Greg Blewett's graph shows how inconsistent he was. When Greg Chappell's form was dynamite, it was really dynamite. When Bradman had a rut for five innings, England must have been very, very worried. Conversely, if he'd made 750 runs in his last five dismissals, they would have been confident that he was due for a low score.
Victor Trumper's is the most surprising for me.
Now that I've got the code working, it only takes a minute or two to make one of these graphs. So feel free to make requests, especially for players where the notion of form might be interesting.
I will also try using three innings rather than five to measure form, when I summon the energy to do so.
Edit added later: If you take all batsmen who average over 40, and scale each batsman's innings so that all of them average 40, and throw all of the data points onto the graph, the slope of the regression curve becomes a rather flat-looking 0.01.
# posted by David Barry : 19:37

![]()
Subscribe to Posts [Atom]