Monday, February 25, 2008
Scheduling cricket around the IPL
I had planned a couple of more blog entries before my holiday to Italy, but I've got distracted. So before I disappear for a week, here are some thoughts on the IPL and cricket scheduling. This is a bit of a change from my usual fare, but since everyone's talking about the IPL and its consequences, I thought it was worth sharing.
I am a big supporter of the IPL, and I hope it's a big success. But there is one big danger that I see, and that's if it expands too much. This year, the IPL teams will play in a double round-robin — fourteen matches each — before semi-finals and final. There's huge scope to make the tournament bigger. Teams in Major League Baseball (where games last about as long as T20's) play 162 games a season. Now I'm not saying that anyone wants a cricket tournament in which each team plays 162 times, but the point is clear: the IPL could get much bigger.
I've done some scribbling, and I think that Test cricket can survive in much its present form as long as the IPL season is not longer than four months. IPL Teams could play, say, five games a fortnight, and so the home-and-away season could be around 35 matches per team, which would be followed by a finals series.
To make it concrete, let's assume that the IPL could fill up February to May.
England's home Tests will have to be between June and September, much as they are now. Most other Tests would be between October and January, though Tests in June or July are possible in, e.g., Australia. (The West Indies never plays Tests before January — does anyone know why? Their domestic season starts in November.)
I see a five-Test tour looking like this:
tour match: days 1-4
tour match: days 7-10
Test 1: days 14-18
Test 2: days 21-25
tour match: days 31-34
Test 3: days 38-42
tour match: days 46-50
Test 4: days 56-60
Test 5: days 63-67
Three-Test tours would be truncated after the third Test. It should be clear what my thoughts on first-class tour matches are! There are no one-day matches, though you could probably squeeze one or two in either at the beginning or at the end. Or you could shorten the tour matches, or get rid of one, to make space.
I would like to see Australia play five-Test series against England, South Africa, and India. Australia's home schedule would look something like:
Eng in summer, WI in winter
NZ, SL in summer, Bd in winter
Ind in summer, Pak in winter
SA in summer
Eng in summer
The Ashes stay on a four-year cycle, and everyone else is on five-year cycles. This could easily be relaxed to six-year cycles. The non-England teams could be shuffled around from winter to summer, depending on other schedules or commercial considerations.
Other countries may also want five-Test series (they'd be good with India-Pakistan, etc.), but they'll have to be able to host Tests outside of the October to January window, have touring teams accept the loss of some tour match days, or the loss of rest days between matches. The other alternative (probably the more reasonable one) is to have six-year cycles.
England's home schedule would look like this (five-year cycle):
Bd (2 Tests to be squeezed in), Aus
WI, SL
SA, NZ
Ind, Pak
Aus
If they had a six-year cycle, it could be:
Aus
WI, SL
SA
Ind, Pak
Aus
NZ, Bd
Or something like that. There are fiddly details that I haven't worked out, but basically if you spend enough time fiddling, everyone should get to play each other, there'll be more five-Test series than there are now, the IPL can go for four months, and Test cricket will survive. The Boards would make less money from international cricket under this proposal, because there aren't any ODI's, but hopefully there will be active and popular domestic T20 competitions to boost the coffers. Your cricket fan in Australia in February watches the NSW v Victoria T20 game before flicking over to watch a Kolkata play Mumbai game afterwards. Something like that. (I'm optimistic about domestic T20 being viable, because I was part of the crowd of over 27000 who watched Queensland play New South Wales at the Gabba in 2006/7. Now, no other Australian domestic crowd recently has come close to that, outside finals, but if it was at the forefront of the cricketing calendar, I think large crowds would be common.)
This is obviously a bit Utopian (and I've ignored the Champions League), but it least it shows in principle that things can all work out.
I should be back blogging next Monday or Tuesday.
Saturday, February 23, 2008
The IPL player auction
Sorry for the delay in updating — I've just got back from a short holiday in Amsterdam. On Tuesday morning I'm heading off to Florence and Rome, so there'll be another break in posting soon.
I had a question on whether Indian players were valued more than non-Indians in the IPL auction. The answer is that they were, by about $250k each. My analysis is a bit rough, since I didn't want to get bogged down in details in the couple of days I have before Italy.
Firstly, it's important to note that it's not a free market — there were requirements on young players, international players, icon players would have distorted the market, etc. But we'll see what the numbers tell us.
I took all the non-icon players who had ODI stats (or, failing that, List A stats) that included batting strike rate. Because it seemed a reasonable thing to do, I gave each player a batting rating, defined as the batting average multiplied by the strike rate, divided by 100, divided by 20 (roughly). For bowlers (and I chose bowlers by looking at them and deciding whether I'd consider their bowling in buying them; there's a grey area of course, but for most players it's pretty obvious) I gave a bowling rating: bowling average times economy rate, divided by 6, divided by 25.
I might be biasing the ratings towards batsmen or towards bowlers, but it shouldn't be too bad. Then I added the batting and bowling ratings for an overall player rating.
I put three other variables into the regression model: number of matches (a bit dodgy in one or two cases, where I used List A rather than ODI's), and dummy variables for Indians and wicket-keepers.
I probably should have done something about the Australians and West Indians, who are only available for half the tournament, but I couldn't be bothered.
Here are the results of the regression:
Key points:
- There is a slight positive correlation between matches (i.e., experience) and salary. For every hundred extra ODI's, the salary goes up by about $65000.
- My hastily calculated player ratings are positively correlated with salary. Increase the batting average (times strike rate) by 10, your salary goes up by $80000.
- If you're Indian, you get a bonus $265000. Indian cricketers can expect to be part of marketing campaigns.
- Wicket-keepers get an extra $135000, and I'll ignore the p value which tells me that it's not significant. The extra money they get is expected, since I didn't incorporate wicket-keeping skills into the player ratings.
- These factors explain 25% of the statistical variance, which is 50% of the salaries in cricket terms.
Now just for a bit of fun, I decided to use the player ratings to work out how many dollars each team spent per player rating point. I've fixed it so that the teams are on a scale of 3 to 9, so that I can compare with Q.
The conclusion here is that at least one of me and Q has no idea what we're doing. Of course, my analysis is based purely on ODI numbers (possibly out of date — several people have said that T20 is a young man's game, with the play very fast), whereas Q's looked at T20 form and crowd-drawing power. Even so! I suspect the difference of our ratings of Jaipur is that they didn't actually spend much money on players. So they got quality for what they spent, but the overall team isn't all that good. The point of the bidding process is to get the best team (including marketing, etc.), not to get the most player rating points per dollar.
I had a question on whether Indian players were valued more than non-Indians in the IPL auction. The answer is that they were, by about $250k each. My analysis is a bit rough, since I didn't want to get bogged down in details in the couple of days I have before Italy.
Firstly, it's important to note that it's not a free market — there were requirements on young players, international players, icon players would have distorted the market, etc. But we'll see what the numbers tell us.
I took all the non-icon players who had ODI stats (or, failing that, List A stats) that included batting strike rate. Because it seemed a reasonable thing to do, I gave each player a batting rating, defined as the batting average multiplied by the strike rate, divided by 100, divided by 20 (roughly). For bowlers (and I chose bowlers by looking at them and deciding whether I'd consider their bowling in buying them; there's a grey area of course, but for most players it's pretty obvious) I gave a bowling rating: bowling average times economy rate, divided by 6, divided by 25.
I might be biasing the ratings towards batsmen or towards bowlers, but it shouldn't be too bad. Then I added the batting and bowling ratings for an overall player rating.
I put three other variables into the regression model: number of matches (a bit dodgy in one or two cases, where I used List A rather than ODI's), and dummy variables for Indians and wicket-keepers.
I probably should have done something about the Australians and West Indians, who are only available for half the tournament, but I couldn't be bothered.
Here are the results of the regression:
Modèle 1: Estimation en MCO avec 70 observations 1-70
Variable dépendante: salary

      VARIABLE       COEFFICIENT        ERR. STD         T           p. critique
  const             46927,8         114520             0,410   0,68332
  mat                 673,801          361,921         1,862   0,06716 *
  rating           163109            62931,6           2,592   0,01178 **
  indian           267326            71927,6           3,717   0,00042 ***
  keeper           136852            93199,5           1,468   0,14682

  Moyenne de la variable dépendante = 504357
  Écart-type de la var. dép. = 286130
  Somme des carrés des résidus = 4,25589e+012
  Erreur standard des résidus = 255881
  R2 non-ajusté = 0,246619
Key points:
- There is a slight positive correlation between matches (i.e., experience) and salary. For every hundred extra ODI's, the salary goes up by about $65000.
- My hastily calculated player ratings are positively correlated with salary. Increase the batting average (times strike rate) by 10, your salary goes up by $80000.
- If you're Indian, you get a bonus $265000. Indian cricketers can expect to be part of marketing campaigns.
- Wicket-keepers get an extra $135000, and I'll ignore the p value which tells me that it's not significant. The extra money they get is expected, since I didn't incorporate wicket-keeping skills into the player ratings.
- These factors explain 25% of the statistical variance, which is 50% of the salaries in cricket terms.
Now just for a bit of fun, I decided to use the player ratings to work out how many dollars each team spent per player rating point. I've fixed it so that the teams are on a scale of 3 to 9, so that I can compare with Q.
Team        Me   Q
Jaipur      9    3
Chennai     6,3  7
Mumbai      3    6
Bangalore   5,3  5
Hyderabad   5,8  8
Mohali      3,1  7
Kolkata     3,5  9
Delhi       6,0  9
The conclusion here is that at least one of me and Q has no idea what we're doing. Of course, my analysis is based purely on ODI numbers (possibly out of date — several people have said that T20 is a young man's game, with the play very fast), whereas Q's looked at T20 form and crowd-drawing power. Even so! I suspect the difference of our ratings of Jaipur is that they didn't actually spend much money on players. So they got quality for what they spent, but the overall team isn't all that good. The point of the bidding process is to get the best team (including marketing, etc.), not to get the most player rating points per dollar.
Sunday, February 17, 2008
1800's first-class cricket in England: wicket-keepers
This is Part 9, and also the final instalment, in my series on first-class cricket in the 1800's in England.
1 - data
2 - classification of matches
3 - filling in the gaps
4 - bowlers
5 - batsmen
6 - bowlers across eras
7 - batsmen across eras
8 - all-rounders (across eras)
9 - wicket-keepers
In this post I look at wicket-keepers. I've decided to focus on pure wicket-keeping, and so I've ignored batting. It's a bit boring-listy, but there's a graph below all the tables.
Many of the early scorecards do not indicate who the wicket-keeper was. If there were one or more stumpings, whoever effected the first one was deemed as the keeper. I don't think that this is much of a problem in terms of the tables below, since most of the record-getters played once the scorecards became more complete. Nevertheless, there are probably minor errors, since sometimes teams change wicket-keepers, and I've allocated all the innings byes to the first one (that I know of).
To begin, let's have a look at the leading keepers by dismissal in the 1800's. The last column is the percentage of team runs conceded as byes.
Mordecai Sherwin tops the list. He was, amusingly, a keeper in both cricket and professional soccer. Both Hunter brothers make the top ten.
The leader in terms of dismissals per match (with at least 20 matches) is Charles Smith at 2,69. Behind him are Pilling and Pooley.
If you look down the right-hand column of the above table, one man stands out — Tom Lockyer. He was easily the best in terms of byes in the 1800's. With a qualification of 50 matches:
Fred Huish, early in his career, was showing signs of his greatness as a wicket-keeper. He figures prominently in the next table, which shows the leading keepers by number of dismissals for all first-class matches in England. I've added an extra column — byes per 600 balls. Players from the 19th century are in bold.
Huish never played a Test match, mostly because of Bert Strudwick, two places ahead of him on that table. Bob Taylor is the leader all-time, as we would expect (since he holds the overall first-class record).
My last two tables show a curious phenomenon. The first has the leading keepers by byes percentage. Qualification for both: 60 matches.
Lots and lots of 1980's, with David East the best. Now again, but for byes per 600 balls:
Now Bob Stephenson moves up to first, part of a general movement of 1960's keepers up the rankings. It would appear as though he was unlucky not to play a Test, but with his career coinciding with Taylor's and Alan Knott's, he was kept in county cricket.
I'm guessing that the difference between byes percentage and byes per 600 balls is due to batsmen hitting the ball more often in the 1980's, so that less balls got through to the keeper. Ideally, we'd have a "byes per balls that passed the batsmen". It should be possible to come up with a correction factor based on the run rate (so that you'd use run rate as a proxy for balls hit), but I haven't tried to do so, and in the absence of ball-by-ball data I don't know how accurate it would be.
We know the number of overs in about 95% of the innings that Tom Lockyer kept. In these, he averaged just under 10 byes ber 600 balls, almost exactly the same as Paul Nixon.
I don't want to do era adjustments for wicket-keepers. The balance between bat and ball can change, and so averages should be adjusted accordingly to get comparisons of talent levels. But letting through byes shouldn't change much with eras of low scoring. Still, you might want an idea of how far away from the average keeper of the era someone like Lockyer was, so here's a graph showing the overall byes percentage for each season. There's a lot of early noise because of the low number of matches. There's a huge peak in the era of very low scoring around the 1830's. This isn't just because the byes were constant and the runs were decreasing — there's a peak in the byes per match as well, suggesting that keepers had just as much trouble with the round-arm bowling on those pitches as batsmen did.
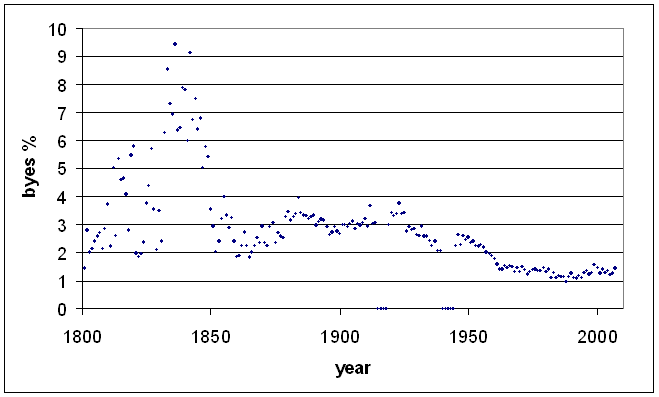
Noteworthy are the jumps that follow the World Wars, telling us that keepers were out of practice and skill levels had dropped. The general trend after World War II was downward until about 1990, when it starts to rise again, presumably when teams started giving more importance to keepers' batting ability.
Looking pre-World-War-I, there are a couple of phases whose causes I don't know. There is a clear rise from the 1860's to the 1880's, before it starts to fall again and then noisily flatten out in around 1900.
And that's the end of this post and this series on 1800's first-class cricket in England. Thanks to anyone who actually read it all.
FIN
1 - data
2 - classification of matches
3 - filling in the gaps
4 - bowlers
5 - batsmen
6 - bowlers across eras
7 - batsmen across eras
8 - all-rounders (across eras)
9 - wicket-keepers
In this post I look at wicket-keepers. I've decided to focus on pure wicket-keeping, and so I've ignored batting. It's a bit boring-listy, but there's a graph below all the tables.
Many of the early scorecards do not indicate who the wicket-keeper was. If there were one or more stumpings, whoever effected the first one was deemed as the keeper. I don't think that this is much of a problem in terms of the tables below, since most of the record-getters played once the scorecards became more complete. Nevertheless, there are probably minor errors, since sometimes teams change wicket-keepers, and I've allocated all the innings byes to the first one (that I know of).
To begin, let's have a look at the leading keepers by dismissal in the 1800's. The last column is the percentage of team runs conceded as byes.
name          start end   mat ct   st  dis   b %
M Sherwin     1876  1896  308 577  205 782   3,05
EW Pooley     1864  1883  289 420  352 772   2,29
H Wood        1881  1899  290 532  114 646   2,87
D Hunter      1888  1899  252 437  180 617   2,98
R Pilling     1877  1889  226 418  187 605   3,04
H Phillips    1869  1891  209 335  184 519   2,97
HR Butt       1890  1899  204 334  130 464   2,46
JH Board      1891  1899  185 329  115 444   2,60
T Lockyer     1849  1866  154 234  112 346   1,78
J Hunter      1878  1888  153 220  118 338   3,91
Mordecai Sherwin tops the list. He was, amusingly, a keeper in both cricket and professional soccer. Both Hunter brothers make the top ten.
The leader in terms of dismissals per match (with at least 20 matches) is Charles Smith at 2,69. Behind him are Pilling and Pooley.
If you look down the right-hand column of the above table, one man stands out — Tom Lockyer. He was easily the best in terms of byes in the 1800's. With a qualification of 50 matches:
name          start end   mat ct   st  dis   b %
T Lockyer     1849  1866  154 234  112 346   1,78
AP Wickham    1878  1899  65  68   42  110   2,03
JA Bush       1870  1890  145 205  93  298   2,13
AE Newton     1885  1899  83  130  50  180   2,21
A Pike        1894  1899  63  99   28  127   2,27
EFS Tylecote  1871  1886  62  90   48  138   2,29
EW Pooley     1864  1883  289 420  352 772   2,29
FH Huish      1895  1899  88  208  23  231   2,36
JP Whiteside  1888  1899  108 159  44  203   2,45
HR Butt       1890  1899  204 334  130 464   2,46
Fred Huish, early in his career, was showing signs of his greatness as a wicket-keeper. He figures prominently in the next table, which shows the leading keepers by number of dismissals for all first-class matches in England. I've added an extra column — byes per 600 balls. Players from the 19th century are in bold.
name          start end   mat ct   st  dis   b %   b/600
RW Taylor     1960  1988  547 1257 155 1412  1,03  2,76
H Strudwick   1902  1927  610 1133 220 1353  2,97  8,63
JT Murray     1952  1975  546 1116 219 1335  2,05  5,50
FH Huish      1895  1914  493 922  377 1299  2,91  8,35
D Hunter      1888  1909  543 910  347 1257  2,59  6,69
B Taylor      1949  1973  520 1036 200 1236  1,54  4,28
HR Butt       1890  1912  543 949  275 1224  3,05  8,89
H Elliott     1920  1947  517 886  292 1178  1,84  4,67
JH Board      1891  1913  482 810  348 1158  2,63  7,82
RC Russell    1981  2004  405 1033 111 1144  0,93  2,92
Huish never played a Test match, mostly because of Bert Strudwick, two places ahead of him on that table. Bob Taylor is the leader all-time, as we would expect (since he holds the overall first-class record).
My last two tables show a curious phenomenon. The first has the leading keepers by byes percentage. Qualification for both: 60 matches.
name          start end   mat ct   st  dis   b %   b/600
DE East       1981  1989  189 479  53  532   0,81  2,40
RJ Turner     1988  2005  233 666  49  715   0,83  2,88
P Whitticase  1984  1995  129 309  14  323   0,84  2,63
GR Stephenson 1967  1980  270 584  77  661   0,85  2,23
BJM Maher     1981  1993  125 279  14  293   0,87  2,85
RC Russell    1981  2004  405 1033 111 1144  0,93  2,92
SJ Rhodes     1984  2004  390 1009 101 1110  0,95  3,02
CP Metson     1981  2001  230 556  51  607   0,95  3,03
CMW Read      1998  2007  151 462  23  485   0,99  3,45
APE Knott     1964  1985  411 1012 101 1113  1,02  2,76
Lots and lots of 1980's, with David East the best. Now again, but for byes per 600 balls:
name          start end   mat ct   st  dis   b %   b/600
GR Stephenson 1967  1980  270 584  77  661   0,85  2,23
DE East       1981  1989  189 479  53  532   0,81  2,40
P Whitticase  1984  1995  129 309  14  323   0,84  2,63
RW Taylor     1960  1988  547 1257 155 1412  1,03  2,76
APE Knott     1964  1985  411 1012 101 1113  1,02  2,76
BJM Maher     1981  1993  125 279  14  293   0,87  2,85
RJ Turner     1988  2005  233 666  49  715   0,83  2,88
RC Russell    1981  2004  405 1033 111 1144  0,93  2,92
BSV Timms     1959  1971  231 456  70  526   1,24  3,00
SJ Rhodes     1984  2004  390 1009 101 1110  0,95  3,02
Now Bob Stephenson moves up to first, part of a general movement of 1960's keepers up the rankings. It would appear as though he was unlucky not to play a Test, but with his career coinciding with Taylor's and Alan Knott's, he was kept in county cricket.
I'm guessing that the difference between byes percentage and byes per 600 balls is due to batsmen hitting the ball more often in the 1980's, so that less balls got through to the keeper. Ideally, we'd have a "byes per balls that passed the batsmen". It should be possible to come up with a correction factor based on the run rate (so that you'd use run rate as a proxy for balls hit), but I haven't tried to do so, and in the absence of ball-by-ball data I don't know how accurate it would be.
We know the number of overs in about 95% of the innings that Tom Lockyer kept. In these, he averaged just under 10 byes ber 600 balls, almost exactly the same as Paul Nixon.
I don't want to do era adjustments for wicket-keepers. The balance between bat and ball can change, and so averages should be adjusted accordingly to get comparisons of talent levels. But letting through byes shouldn't change much with eras of low scoring. Still, you might want an idea of how far away from the average keeper of the era someone like Lockyer was, so here's a graph showing the overall byes percentage for each season. There's a lot of early noise because of the low number of matches. There's a huge peak in the era of very low scoring around the 1830's. This isn't just because the byes were constant and the runs were decreasing — there's a peak in the byes per match as well, suggesting that keepers had just as much trouble with the round-arm bowling on those pitches as batsmen did.
Noteworthy are the jumps that follow the World Wars, telling us that keepers were out of practice and skill levels had dropped. The general trend after World War II was downward until about 1990, when it starts to rise again, presumably when teams started giving more importance to keepers' batting ability.
Looking pre-World-War-I, there are a couple of phases whose causes I don't know. There is a clear rise from the 1860's to the 1880's, before it starts to fall again and then noisily flatten out in around 1900.
And that's the end of this post and this series on 1800's first-class cricket in England. Thanks to anyone who actually read it all.
FIN
Thursday, February 14, 2008
Bowler support
One of the problems in comparing bowlers from different teams is that they often have different levels of support. This is a recurring theme in Murali v Warne debates (in between expletive-laden rages) — Murali took more wickets per Test, but that was because Warne followed McGrath and Gillespie, and Murali only ever had Vaas. Warne had it easier, and that makes Murali's low average more remarkable. But maybe the batsmen didn't try to score as much against Murali, because they could pick off runs easily at the other end.
The debate can go on and on, and it's not clear which factors are the most important. So I asked myself the question, if you swapped the two bowlers between the two teams, what would their records be?
You can't answer this question perfectly, of course, but you can try. For each innings in which the bowler bowled, I defined the support average as the mean of the averages of the four bowlers who bowled the most overs in that innings (three bowlers if the bowler himself would have been one of the four). Note that, unless otherwise stated, the averages used are averages in which each wicket is weighted in proportion to the batting average of the batsman dismissed. I use end-of-career averages (to make my life easier and the numerics more stable).
I'll give an example of what I mean by the support average. Suppose that in one particular innings, the bowlers used were:
bowler (bowler's average): # of overs
A (25): 30
B (24): 34
C (33): 23
D (31): 15
E (45): 6
The support average of bowler A is (24 + 33 + 31)/3 = 29,33. The support average of bowler E is (25 + 24 + 33 + 31)/4 = 28,25.
To do the analysis, for each bowler I took all innings and sorted them by support average. I then binned them into quartiles (to reduce the noise and make for easier interpretation), that is, the quarter of innings with the lowest support averages, the quarter with the next lowest support averages, and so on.
Then for each quartile I calculated the bowler's average, and also the average support average, with the latter weighted by the number of balls bowled in each innings (so that, for instance, an innings where the bowler only bowled one over would barely be counted).
Then you can make tables like these ones:
You can see that Murali's support average is indeed much higher than Warne's, as you would expect. I don't know how much I want to read into individual trends — four data points, even aggregated ones, aren't a lot. That won't stop me trying. The overall trend for Warne is for his average to increase as his support gets weaker. In particular, for the upper quartile (the only one near where Murali has to bowl) his average is the highest, getting close to 30. Murali seems to turn it on when he has no-one to support him at all.
How about another pair, this time from the 1980's?
When Marshall didn't have Croft, Garner, Roberts, and/or Holding around him, he was still awesome.
And since I've apparently made comparing pairs of bowlers a theme for this post, here are the rather surprising results for McGrath and Gillespie:
It seems that Gillespie did actually do pretty well when McGrath wasn't around, and it was McGrath who got worse (a little bit) when he didn't have support. Well, perhaps — it could just be an artifact of McGrath's career trajectory, I haven't checked.
These are all well and good, but we'd like to do a bit more serious analysis with them. If you fit a regression line to an individual player, you can get a rough guide of how their average will change when the support gets better or worse. While it might be dubious to do this for just one player, if you do it for all players, the noise should largely cancel out and we'll be left with some solid numbers.
So, I took all bowlers with 100 Test wickest at at least 3 wickets per Test, calculated the slope of the regression line for each, and then took the mean of the slopes. The result was 0,50. That's a pretty hefty figure. It means that, on average, if the support average goes down by a run, then the bowler's average will go down by half a run. But it's inflated by the presence of some outliers. If you exclude players with less than 50 Tests (remember that we're dealing with quartiles here, so you need a large number of Tests to get reasonable quartile results), that figure drops to 0,25. So if the support average drops by four runs, the bowler's average drops by one run, on average.
You might be wondering if there's a correlation between average and the regression slope. There isn't. The scatterplot is equal parts scatter and plot.
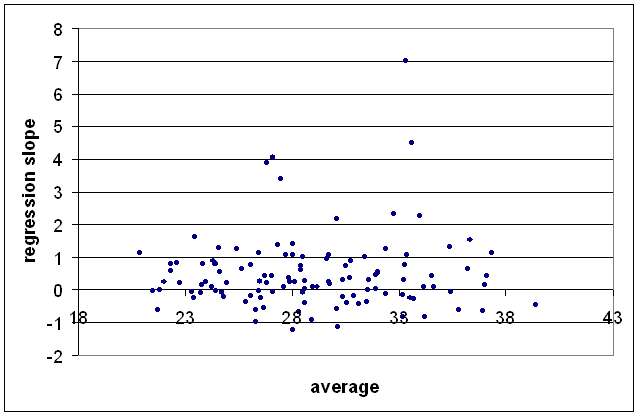
No trend emerges if you make the qualification 50 Tests to get rid of the outliers. I tried a few other variables, but I couldn't find anything with an R-squared of better than about 0,004. Even in cricket terms, none of them explained more than 7% of the data.
The debate can go on and on, and it's not clear which factors are the most important. So I asked myself the question, if you swapped the two bowlers between the two teams, what would their records be?
You can't answer this question perfectly, of course, but you can try. For each innings in which the bowler bowled, I defined the support average as the mean of the averages of the four bowlers who bowled the most overs in that innings (three bowlers if the bowler himself would have been one of the four). Note that, unless otherwise stated, the averages used are averages in which each wicket is weighted in proportion to the batting average of the batsman dismissed. I use end-of-career averages (to make my life easier and the numerics more stable).
I'll give an example of what I mean by the support average. Suppose that in one particular innings, the bowlers used were:
bowler (bowler's average): # of overs
A (25): 30
B (24): 34
C (33): 23
D (31): 15
E (45): 6
The support average of bowler A is (24 + 33 + 31)/3 = 29,33. The support average of bowler E is (25 + 24 + 33 + 31)/4 = 28,25.
To do the analysis, for each bowler I took all innings and sorted them by support average. I then binned them into quartiles (to reduce the noise and make for easier interpretation), that is, the quarter of innings with the lowest support averages, the quarter with the next lowest support averages, and so on.
Then for each quartile I calculated the bowler's average, and also the average support average, with the latter weighted by the number of balls bowled in each innings (so that, for instance, an innings where the bowler only bowled one over would barely be counted).
Then you can make tables like these ones:
SK Warne      q1     q2     q3     q4     overall
supp avg      26,32  27,81  29,61  35,24  29,92
bowl avg      26,58  29,01  26,59  29,52  27,91

M Muralidaran q1     q2     q3     q4     overall
supp avg      33,86  37,19  39,26  47,28  39,45
bowl avg      23,01  24,26  27,98  23,15  24,43
You can see that Murali's support average is indeed much higher than Warne's, as you would expect. I don't know how much I want to read into individual trends — four data points, even aggregated ones, aren't a lot. That won't stop me trying. The overall trend for Warne is for his average to increase as his support gets weaker. In particular, for the upper quartile (the only one near where Murali has to bowl) his average is the highest, getting close to 30. Murali seems to turn it on when he has no-one to support him at all.
How about another pair, this time from the 1980's?
RJ Hadlee     q1     q2     q3     q4     overall
supp avg      34,51  36,63  38,49  45,75  38,81
bowl avg      24,80  19,69  26,15  25,80  23,96

MD Marshall   q1     q2     q3     q4     overall
supp avg      24,96  27,13  30,01  36,55  29,73
bowl avg      25,01  19,29  20,75  23,22  21,83
When Marshall didn't have Croft, Garner, Roberts, and/or Holding around him, he was still awesome.
And since I've apparently made comparing pairs of bowlers a theme for this post, here are the rather surprising results for McGrath and Gillespie:
GD McGrath    q1     q2     q3     q4     overall
supp avg      28,02  29,32  30,61  33,38  30,28
bowl avg      22,19  20,41  21,92  25,78  22,36

JN Gillespie  q1     q2     q3     q4     overall
supp avg      26,47  27,43  28,49  34,30  29,28
bowl avg      32,81  28,75  30,62  22,23  28,05
It seems that Gillespie did actually do pretty well when McGrath wasn't around, and it was McGrath who got worse (a little bit) when he didn't have support. Well, perhaps — it could just be an artifact of McGrath's career trajectory, I haven't checked.
These are all well and good, but we'd like to do a bit more serious analysis with them. If you fit a regression line to an individual player, you can get a rough guide of how their average will change when the support gets better or worse. While it might be dubious to do this for just one player, if you do it for all players, the noise should largely cancel out and we'll be left with some solid numbers.
So, I took all bowlers with 100 Test wickest at at least 3 wickets per Test, calculated the slope of the regression line for each, and then took the mean of the slopes. The result was 0,50. That's a pretty hefty figure. It means that, on average, if the support average goes down by a run, then the bowler's average will go down by half a run. But it's inflated by the presence of some outliers. If you exclude players with less than 50 Tests (remember that we're dealing with quartiles here, so you need a large number of Tests to get reasonable quartile results), that figure drops to 0,25. So if the support average drops by four runs, the bowler's average drops by one run, on average.
You might be wondering if there's a correlation between average and the regression slope. There isn't. The scatterplot is equal parts scatter and plot.
No trend emerges if you make the qualification 50 Tests to get rid of the outliers. I tried a few other variables, but I couldn't find anything with an R-squared of better than about 0,004. Even in cricket terms, none of them explained more than 7% of the data.
Tuesday, February 12, 2008
1800's first-class cricket in England: all-rounders (across eras)
This is Part 8 in my series on first-class cricket in the 1800's in England.
1 - data
2 - classification of matches
3 - filling in the gaps
4 - bowlers
5 - batsmen
6 - bowlers across eras
7 - batsmen across eras
8 - all-rounders (across eras)
9 - wicket-keepers
In this post, I look at all-rounders. As I did for Test cricketers, I'll be ranking players by the ratio of batting average to bowling average, where the averages are weighted as in Parts 6 and 7.
Let's start, as always, with the 1800's. The averages below are with respect to 16,6, the overall average for the period in question. The +/- percentage figure applies both to the bowling average (well, technically it applies to the regular bowling average; I fondly hope that it's accurate for the weighted average) and (by a trick of mathematics) to the ratio as well. I've given the wickets per match for those interested; recall that these are underestimates for bowlers whose wicket tallies are estimated. Qualifications: 2000 runs and at least two (regular) wickets per match.
Lambert's pretty clear at the top. Beauclerk is mildly ahead of WG Grace and Allan Steel, but the uncertainty means that all wa can say is that he's likely to be somewhere between second and sixth.
Before I started on this extended exercise in analysing old English players, I didn't know much at all about the cricketers of the era, apart from WG Grace. One name I did know was Alfred Mynn, rated by John Woodcock as the fourth-greatest cricketer of all time. Now, Woodcock's list has lots of problems (most notably, WG Grace is number one, ahead of Bradman), but I was interested to see how Mynn would fare after adjusting for eras. He comes in at number seven (plus or minus one) on the table above. But if (as might have happened) Woodcock ignored cricket before 1830, then you can see what his method was — he chose near the top all-rounders with huge aggregates. Mynn was not a special batsman, but he was a prolific wicket-taker, even if his bowling average wasn't remarkable for his time. Add in his popularity, and his dominance of single-wicket matches, and you can see where Woodcock was coming from, even if number four is too high.
Now let's move onto all first-class cricket in England. Players whose career began in the 1800's are in bold. Averages are with respect to 24,5.
Keith Miller comes out on top, ahead of (surprisingly) the Big Ship Warwick Armstrong. Lambert leads a host of 19th century players, who are vastly over-represented in the table — almost half of the top thirty spots! Given the number of players since 1900, you'd expect only about five or six from the 1800's. Alfred Mynn is a long way down the table (20th place), but if you give more weighting to wickets per match, he would be higher.
At number nine is Frank Tarrant, someone I'd never heard of. He never played a Test, which, at first glance, is extraordinary for someone with his first-class record. His lack of Test cricket is explained by his being Australian and playing for Middlesex, which barred him from playing for Australia (though he did play for the MCC at times).
The abundance of 19th century all-rounders tells us something about the nature of the game and/or its players. I'm not sure exactly what factors contributed to it, but I would suggest the following. When cricket was less developed, and had fewer top-level players, a talented athlete was more likely to dominate with both bat and ball. As batting and bowling techniques became more sophisticated, and the number of players increased, there were more specialists in both disciplines, making it harder for the talented cricketer to be good (relative to his peers) with both bat and ball.
Next up (and the last instalment in this series): wicket-keepers.
1 - data
2 - classification of matches
3 - filling in the gaps
4 - bowlers
5 - batsmen
6 - bowlers across eras
7 - batsmen across eras
8 - all-rounders (across eras)
9 - wicket-keepers
In this post, I look at all-rounders. As I did for Test cricketers, I'll be ranking players by the ratio of batting average to bowling average, where the averages are weighted as in Parts 6 and 7.
Let's start, as always, with the 1800's. The averages below are with respect to 16,6, the overall average for the period in question. The +/- percentage figure applies both to the bowling average (well, technically it applies to the regular bowling average; I fondly hope that it's accurate for the weighted average) and (by a trick of mathematics) to the ratio as well. I've given the wickets per match for those interested; recall that these are underestimates for bowlers whose wicket tallies are estimated. Qualifications: 2000 runs and at least two (regular) wickets per match.
name             start end   mat  runs  avg     wkts   avg   wpm   ratio +/- %
W Lambert        1801  1817  62   2961  37,05   318,1  16,3  5,1   2,3   10,0
Lord F Beauclerk 1801  1825  94   4319  37,28   406,4  18,5  4,3   2,0   10,0
WG Grace         1865  1908  838  46792 37,41   2495   18,91 2,98  1,98  0,0
AG Steel         1877  1895  142  6184  28,28   699    14,53 4,92  1,95  0,0
J Broadbridge    1814  1840  90   2368  26,82   407,6  14,2  4,5   1,9   9,9
CT Studd         1879  1884  85   3928  30,35   426    16,89 5,01  1,80  0,2
A Mynn           1832  1859  200  4749  27,02   1059,9 15,9  5,3   1,7   7,0
CG Taylor        1836  1859  122  3020  33,56   292,0  20,5  2,4   1,6   7,0
EH Budd          1803  1831  68   2597  30,74   285,8  20,5  4,2   1,5   10,0
W Caffyn         1849  1873  180  5405  24,26   564    16,17 3,13  1,50  0,3
T Hayward        1854  1872  108  4487  27,00   237    18,00 2,19  1,50  0,6
J Wisden         1845  1863  175  4020  19,77   1037,5 13,9  5,9   1,4   3,4
RG Barlow        1871  1891  321  10074 18,43   879    13,06 2,74  1,41  0,0
G Giffen         1882  1896  158  5621  20,23   502    14,81 3,18  1,37  0,0
GA Lohmann       1884  1896  256  6495  16,17   1590   11,99 6,21  1,35  0,0
CTB Turner       1888  1893  93   2118  13,15   610    10,34 6,56  1,27  0,0
GA Davidson      1886  1898  155  5338  18,45   605    15,35 3,90  1,20  0,0
W Bates          1877  1887  257  8651  19,09   746    16,13 2,90  1,18  0,0
WE Midwinter     1877  1884  127  3533  17,90   330    15,14 2,60  1,18  0,0
W Flowers        1877  1896  409  12035 17,61   1085   15,25 2,65  1,15  0,0
Lambert's pretty clear at the top. Beauclerk is mildly ahead of WG Grace and Allan Steel, but the uncertainty means that all wa can say is that he's likely to be somewhere between second and sixth.
Before I started on this extended exercise in analysing old English players, I didn't know much at all about the cricketers of the era, apart from WG Grace. One name I did know was Alfred Mynn, rated by John Woodcock as the fourth-greatest cricketer of all time. Now, Woodcock's list has lots of problems (most notably, WG Grace is number one, ahead of Bradman), but I was interested to see how Mynn would fare after adjusting for eras. He comes in at number seven (plus or minus one) on the table above. But if (as might have happened) Woodcock ignored cricket before 1830, then you can see what his method was — he chose near the top all-rounders with huge aggregates. Mynn was not a special batsman, but he was a prolific wicket-taker, even if his bowling average wasn't remarkable for his time. Add in his popularity, and his dominance of single-wicket matches, and you can see where Woodcock was coming from, even if number four is too high.
Now let's move onto all first-class cricket in England. Players whose career began in the 1800's are in bold. Averages are with respect to 24,5.
name             start end   mat  runs  avg     wkts   avg   wpm   ratio +/- %
KR Miller        1945  1959  75   4253  49,22   164    17,59 2,19  2,80  0,0
WW Armstrong     1902  1921  124  5641  41,87   407    16,36 3,28  2,56  0,0
W Lambert        1801  1817  62   2961  54,68   318,1  24,01 5,13  2,28  10,0
RJ Hadlee        1973  1990  187  6887  30,48   780    14,13 4,17  2,16  0,0
GStA Sobers      1957  1974  209  13491 48,01   548    23,38 2,62  2,05  0,0
FE Woolley       1906  1938  886  54535 40,98   1893   20,11 2,14  2,04  0,0
WG Grace         1865  1908  838  52043 51,85   2675   25,62 3,19  2,02  0,0
Lord F Beauclerk 1801  1825  94   4319  55,02   406,4  27,3  4,3   2,0   10,0
FA Tarrant       1903  1914  295  15925 36,93   1327   18,92 4,50  1,95  0,0
AG Steel         1877  1895  142  6184  41,74   699    21,45 4,92  1,95  0,0
J Broadbridge    1814  1840  90   2368  39,58   407,6  21,0  4,5   1,9   9,9
JM Gregory       1919  1926  77   2869  34,26   281    18,49 3,65  1,85  0,0
GH Hirst         1891  1929  801  35378 35,52   2687   19,26 3,35  1,84  0,0
CT Studd         1879  1884  85   3928  44,80   426    24,92 5,01  1,80  0,2
MJ Procter       1965  1981  264  14733 32,27   848    18,31 3,21  1,76  0,0
W Rhodes         1898  1930  1007 35015 30,35   3960   17,43 3,93  1,74  0,0
GA Faulkner      1907  1924  74   3046  29,83   267    17,42 3,61  1,71  0,0
FS Jackson       1890  1907  301  15626 38,88   744    22,81 2,47  1,70  0,0
JW Hearne        1909  1936  593  34438 41,25   1687   24,22 2,84  1,70  0,0
A Mynn           1832  1859  200  4749  39,88   1059,9 23,5  5,3   1,7   7,0
TL Goddard       1955  1962  48   2549  32,85   140    19,39 2,92  1,69  0,0
SG Smith         1906  1914  143  7575  33,87   606    20,48 4,24  1,65  0,0
CG Taylor        1836  1859  122  3020  49,52   292,0  30,3  2,4   1,6   7,0
R Kilner         1911  1927  389  13722 29,48   917    18,53 2,36  1,59  0,0
Imran Khan       1971  1988  240  11679 31,80   733    20,17 3,05  1,58  0,0
JR Mason         1893  1914  324  16619 35,92   817    23,71 2,52  1,52  0,0
EH Budd          1803  1831  68   2597  45,37   285,8  30,2  4,2   1,5   10,0
W Caffyn         1849  1873  180  5405  35,81   564    23,87 3,13  1,50  0,3
T Hayward        1854  1872  108  4487  39,85   237    26,58 2,19  1,50  0,6
IJ Harvey        1999  2007  75   4044  28,43   219    19,11 2,92  1,49  0,0
Keith Miller comes out on top, ahead of (surprisingly) the Big Ship Warwick Armstrong. Lambert leads a host of 19th century players, who are vastly over-represented in the table — almost half of the top thirty spots! Given the number of players since 1900, you'd expect only about five or six from the 1800's. Alfred Mynn is a long way down the table (20th place), but if you give more weighting to wickets per match, he would be higher.
At number nine is Frank Tarrant, someone I'd never heard of. He never played a Test, which, at first glance, is extraordinary for someone with his first-class record. His lack of Test cricket is explained by his being Australian and playing for Middlesex, which barred him from playing for Australia (though he did play for the MCC at times).
The abundance of 19th century all-rounders tells us something about the nature of the game and/or its players. I'm not sure exactly what factors contributed to it, but I would suggest the following. When cricket was less developed, and had fewer top-level players, a talented athlete was more likely to dominate with both bat and ball. As batting and bowling techniques became more sophisticated, and the number of players increased, there were more specialists in both disciplines, making it harder for the talented cricketer to be good (relative to his peers) with both bat and ball.
Next up (and the last instalment in this series): wicket-keepers.
Sunday, February 10, 2008
All-rounderness
The statistical judging of all-rounders is usually not done in what I would consider a satisfactory way. I'm not really going to remedy this problem in this post, though I will present some ranked lists. It's more a case of looking at the stats and seeing why it's hard to get them to agree well with common sense (without making some arbitrary decisions).
I'll only be considering batsman-bowler all-rounders. If you want to comment about wicket-keepers, it should be about Tim Zoehrer.
The base of this analysis will be the bowling averages with wickets weighted by the batting averages of the batsmen dismissed, and the batting averages with runs weighted by the strength of the bowling attack. This gives a comparison across all eras, and rewards those players who performed well against stronger sides. Both the averages I use in this post are normalised to 31,48, which is the overall batting average for all Tests. All references to averages below are these weighted averages.
My main ranking tool will be the batting average divided by the bowling average. I prefer this to the difference, which is more commonly used, because I think it gets closer to a definition of "all-rounder-ness". So, for instance, a batting average of 60 and a bowling average of 30 gives a ratio of 2. A batting average of 40 and a bowling average of 20 also gives a ratio of 2. I think this is fair — in the first case, you have an all-time great batsman who was a good bowler, and in the second you have an all-time great bowler who was a good batsman. You might think that one is a better player than the other, but I'm trying to get at the all-rounder-ness. I hope that's clear.
So, let's think of what qualities we'd like and qualifications we'll use in ranking the best genuine all-rounders of all time.
1. 20 Test innings
2. At least 2 wickets per Test (I don't use weighted wickets here; I just want to make sure that they bowled regularly)
3. A batting average above average (i.e., higher than 31,48)
4. A bowling average below average (i.e., lower than 31,48)
The top seven all-rounders of all time are then as follows. (Runs and wickets are the regular runs and wickets; wpm is wickets per match; ratio is the ratio of batting average to bowling average).
Why only seven? Because that's all there is. No other players satisfy those four conditions above.
I'm actually pretty happy with that list. It's obviously not the list of the best all-rounders ever, but as a list of the most all-rounder of all-rounders, I think it works. Keith Miller just beats Imran Khan as the best ever.
Now let's remove requirements 3 and 4 above and see what we get.
Now Sobers returns to number one, which is where most judges would put him. You can see why he missed out on the previous list — his bowling wasn't that good. Despite an average in the mid-30's (both weighted and regular), he was actually a very economical bowler. A high average and low economy rate (2,22) means that his strike rate was appallingly bad, over 90. Not the go-to man if you need a wicket! But he's generally considered the second-greatest ever player because no other great batsman could bowl so well. Even if "so well" is not so well.
The cut-off of 2 wickets per Test is pretty arbitrary, and it would be unfair to stop here, because it would exclude Jacques Kallis. For my last table, I've lowered the bar to just 1 wicket per Test. This means that a bunch of part-timers are included. While it would be silly to consider them as being as good as the more regular wicket-takers given here, the stats must tell some story — perhaps it suggests that they were underbowled, or perhaps they were just lucky and dismissed a few good batsmen from time to time.
And Kallis actually slots in at number one! Bob Cowper, with his part-time offies, will probably suprise most of you (it surprised me, even though I was vaguely aware of his handy bowling). Andrew Symonds' career is definitely on the improve. His regular bowling average is now under 35. That his weighted bowling average is just over 28 tells us that he's dismissing some good batsmen.
So there you go. I don't know what features you'd want in an ideal ranking of all-rounders. You could set boundary of 2 wickets per Test, and penalise players (such as Kallis) who take less wickets, but setting the boundary would be arbitrary.
Charles Davis, when rating bowlers, actually gives equal weighting to wickets per Test and bowling average. While I see the arguments for doing so (and it would eliminate the problem of setting that boundary), I still like to fall back on the average, so as not to unduly reward bowlers with no support.
I'll only be considering batsman-bowler all-rounders. If you want to comment about wicket-keepers, it should be about Tim Zoehrer.
The base of this analysis will be the bowling averages with wickets weighted by the batting averages of the batsmen dismissed, and the batting averages with runs weighted by the strength of the bowling attack. This gives a comparison across all eras, and rewards those players who performed well against stronger sides. Both the averages I use in this post are normalised to 31,48, which is the overall batting average for all Tests. All references to averages below are these weighted averages.
My main ranking tool will be the batting average divided by the bowling average. I prefer this to the difference, which is more commonly used, because I think it gets closer to a definition of "all-rounder-ness". So, for instance, a batting average of 60 and a bowling average of 30 gives a ratio of 2. A batting average of 40 and a bowling average of 20 also gives a ratio of 2. I think this is fair — in the first case, you have an all-time great batsman who was a good bowler, and in the second you have an all-time great bowler who was a good batsman. You might think that one is a better player than the other, but I'm trying to get at the all-rounder-ness. I hope that's clear.
So, let's think of what qualities we'd like and qualifications we'll use in ranking the best genuine all-rounders of all time.
1. 20 Test innings
2. At least 2 wickets per Test (I don't use weighted wickets here; I just want to make sure that they bowled regularly)
3. A batting average above average (i.e., higher than 31,48)
4. A bowling average below average (i.e., lower than 31,48)
The top seven all-rounders of all time are then as follows. (Runs and wickets are the regular runs and wickets; wpm is wickets per match; ratio is the ratio of batting average to bowling average).
name             mat runs  avg     wkts avg   wpm   ratio
KR Miller        55  2958  35,37   170  23,20 3,09  1,52
Imran Khan       88  3807  36,07   362  24,01 4,11  1,50
W Bates          15  656   36,05   50   26,96 3,33  1,34
TL Goddard       41  2516  35,60   123  27,06 3,00  1,32
IT Botham        102 5200  33,43   383  30,51 3,75  1,10
TE Bailey        61  2290  32,23   132  30,33 2,16  1,06
JM Gregory       24  1146  32,89   85   31,24 3,54  1,05
Why only seven? Because that's all there is. No other players satisfy those four conditions above.
I'm actually pretty happy with that list. It's obviously not the list of the best all-rounders ever, but as a list of the most all-rounder of all-rounders, I think it works. Keith Miller just beats Imran Khan as the best ever.
Now let's remove requirements 3 and 4 above and see what we get.
name             mat runs  avg     wkts avg   wpm   ratio
GStA Sobers      93  8032  54,62   235  34,63 2,53  1,58
KR Miller        55  2958  35,37   170  23,20 3,09  1,52
Imran Khan       88  3807  36,07   362  24,01 4,11  1,50
AG Steel         13  600   48,93   29   35,16 2,23  1,39
W Bates          15  656   36,05   50   26,96 3,33  1,34
TL Goddard       41  2516  35,60   123  27,06 3,00  1,32
AK Davidson      44  1328  27,75   186  21,51 4,23  1,29
GA Faulkner      25  1754  45,89   82   36,35 3,28  1,26
SM Pollock       108 3781  30,31   421  24,18 3,90  1,25
AW Greig         58  3599  39,76   141  33,45 2,43  1,19
RJ Hadlee        86  3124  26,09   431  23,76 5,01  1,10
IT Botham        102 5200  33,43   383  30,51 3,75  1,10
TE Bailey        61  2290  32,23   132  30,33 2,16  1,06
W Barnes         21  725   30,57   51   28,81 2,43  1,06
JM Gregory       24  1146  32,89   85   31,24 3,54  1,05
A Flintoff       66  3331  31,06   190  29,89 2,88  1,04
MA Noble         42  1997  33,12   121  32,61 2,88  1,02
CL Cairns        62  3320  32,53   218  32,07 3,52  1,01
G Ulyett         25  949   32,25   50   31,93 2,00  1,01
C Kelleway       26  1422  37,08   52   37,45 2,00  0,99
Now Sobers returns to number one, which is where most judges would put him. You can see why he missed out on the previous list — his bowling wasn't that good. Despite an average in the mid-30's (both weighted and regular), he was actually a very economical bowler. A high average and low economy rate (2,22) means that his strike rate was appallingly bad, over 90. Not the go-to man if you need a wicket! But he's generally considered the second-greatest ever player because no other great batsman could bowl so well. Even if "so well" is not so well.
The cut-off of 2 wickets per Test is pretty arbitrary, and it would be unfair to stop here, because it would exclude Jacques Kallis. For my last table, I've lowered the bar to just 1 wicket per Test. This means that a bunch of part-timers are included. While it would be silly to consider them as being as good as the more regular wicket-takers given here, the stats must tell some story — perhaps it suggests that they were underbowled, or perhaps they were just lucky and dismissed a few good batsmen from time to time.
name             mat runs  avg     wkts avg   wpm   ratio
JH Kallis        113 9331  50,52   223  31,50 1,97  1,60
RM Cowper        27  2061  44,43   36   28,14 1,33  1,58
GStA Sobers      93  8032  54,62   235  34,63 2,53  1,58
FS Jackson       20  1415  55,40   24   35,89 1,20  1,54
KR Miller        55  2958  35,37   170  23,20 3,09  1,52
Imran Khan       88  3807  36,07   362  24,01 4,11  1,50
CG Macartney     35  2131  44,52   45   30,30 1,29  1,47
AG Steel         13  600   48,93   29   35,16 2,23  1,39
A Symonds        19  1031  38,34   22   28,16 1,16  1,36
W Bates          15  656   36,05   50   26,96 3,33  1,34
TL Goddard       41  2516  35,60   123  27,06 3,00  1,32
AK Davidson      44  1328  27,75   186  21,51 4,23  1,29
EJ Barlow        30  2516  40,24   40   31,36 1,33  1,28
GA Faulkner      25  1754  45,89   82   36,35 3,28  1,26
SM Pollock       108 3781  30,31   421  24,18 3,90  1,25
BM McMillan      38  1968  37,59   75   30,46 1,97  1,23
ER Dexter        62  4502  43,58   66   35,48 1,06  1,23
FMM Worrell      51  3860  49,45   69   40,78 1,35  1,21
AW Greig         58  3599  39,76   141  33,45 2,43  1,19
JDP Oram         25  1380  37,47   49   33,21 1,96  1,13
RJ Hadlee        86  3124  26,09   431  23,76 5,01  1,10
IT Botham        102 5200  33,43   383  30,51 3,75  1,10
TE Bailey        61  2290  32,23   132  30,33 2,16  1,06
W Barnes         21  725   30,57   51   28,81 2,43  1,06
JM Gregory       24  1146  32,89   85   31,24 3,54  1,05
NWD Yardley      20  812   23,53   21   22,63 1,05  1,04
A Flintoff       66  3331  31,06   190  29,89 2,88  1,04
Mushtaq Mohammad 57  3643  37,45   79   36,35 1,39  1,03
MA Noble         42  1997  33,12   121  32,61 2,88  1,02
CL Cairns        62  3320  32,53   218  32,07 3,52  1,01
And Kallis actually slots in at number one! Bob Cowper, with his part-time offies, will probably suprise most of you (it surprised me, even though I was vaguely aware of his handy bowling). Andrew Symonds' career is definitely on the improve. His regular bowling average is now under 35. That his weighted bowling average is just over 28 tells us that he's dismissing some good batsmen.
So there you go. I don't know what features you'd want in an ideal ranking of all-rounders. You could set boundary of 2 wickets per Test, and penalise players (such as Kallis) who take less wickets, but setting the boundary would be arbitrary.
Charles Davis, when rating bowlers, actually gives equal weighting to wickets per Test and bowling average. While I see the arguments for doing so (and it would eliminate the problem of setting that boundary), I still like to fall back on the average, so as not to unduly reward bowlers with no support.
Saturday, February 09, 2008
1800's first-class cricket in England: batsmen across eras
This is Part 7 in my series on first-class cricket in the 1800's in England.
1 - data
2 - classification of matches
3 - filling in the gaps
4 - bowlers
5 - batsmen
6 - bowlers across eras
7 - batsmen across eras
8 - all-rounders (across eras)
9 - wicket-keepers
In this post, I do a comparison of batsmen across eras, by weighting each innings by the strength of the bowling attack. The latter is taken as the "average average" of the bowlers in an innings, weighted by the number of balls bowled by each. (You can see the results for Test matches here.) The same effects (only now for batsmen) occur here as in the weighted bowling averages in Part 6 — batsmen are rewarded for scoring runs against better bowling attacks, and batsmen in low-scoring eras are rewarded because typically the bowlers will have correspondingly low averages.
For innings where the bowlers' overs are not recorded, I've instead used the overall batting average for that season. I couldn't see an easy way of getting an unbiased estimate of the bowling strength, when we don't know who bowled. Using the season average will in general inflate the modified batting average (since typically a batsman will score more heavily against weaker attacks, but using the season average counts that as the same as scoring against a strong attack). But for the players near the top of the tables below, this is not so likely — these batsmen tend to "rise to the occasion" and perform disproportionately better against stronger bowling attacks. Nevertheless, perhaps you might want to put a mental asterisk next to players whose careers included matches from before 1855.
Also, some of the bowling averages are estimates (even where we know the overs bowled), so some of the weighted averages should only be given to one decimal place. But I'm getting lazy.
It's interesting to see a graph of the season averages:
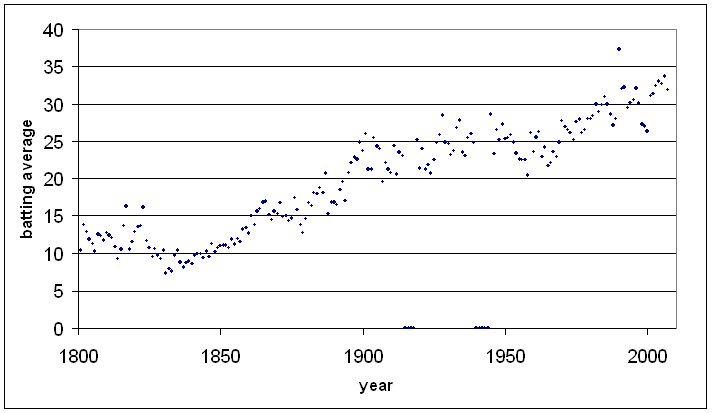
There's a lot of noise in the early years because not many first-class matches were played (sometimes only one). The lowest-scoring season was 1831, when the average of runs off the bat (that is, excluding extras) was just 7,35. You can have a look at the scorecards for that season here.
To start our comparisons of batsmen, we look at just the 1800's. I've given the weighted runs, regular average, and (once again) two weighted averages, one with respect to 16,6 (the overall average for the 1800's) and one with respect to 24,5 (the overall average from 1801 to 2007). One is just a scaling of the other. Qualification: 2000 runs.
Ranji's high average wasn't just because batting was getting easier towards the end of the century — even allowing for that he still comes out on top. Once again, Robert Poore's lucky, since his career went downhill after he fought in the Boer War.
Fuller Pilch was described a few years after his retirement as the best batsman ever, and he kept this tag until WG Grace came along. From the little I've read about him, he seems to be the first man to consistently get his foot to the pitch of the ball. In an era where pitches were of very low quality, smothering any turn or uneven bounce was very important.
It's worth commenting on the discrepancy between the rankings in the table (i.e., Pilch ahead of Grace) and the opinion of the time (Grace ahead of Pilch). Grace was considered a better batsman than Pilch because he could play attacking shots off a wider range of deliveries. But since Grace's innovations to batting technique spread to the other cricketers of the time, he didn't stand out as much as Pilch — scoring for most batsman improved after Grace.
It is sad that Nicholas Felix is so called, since his actual surname was Wanostrocht. He wanted to be known as Felix, but Wanostrocht is such a cool name for a cricketer that I've gone against his wishes in these tables. In addition to being an excellent batsman in a low-scoring era, he also invented a type of bowling machine.
Now let's compare batsmen in England across all eras. I was unsure as to how useful this would be — we all know of batsmen who have excellent records in domestic cricket but do terribly in Tests. But weighting runs by the strength of the bowling attack does a pretty good job in discarding that breed of batsman. Of course, it also doesn't allow for players such as Marcus Trescothick, who have mediocre county records but respectable Test numbers. Players who played in the 1800's are in bold.
The top spot should be pretty uncontroversial. Vijay Merchant is at number four — he is perhaps not famous enough for having the second-highest first-class average of all time (71,64). Pilch slots in at five, followed by a string of Australians. You'll note that WG Grace fell significantly in the years between 1899 and his retirement in 1908. It's that old story of a player hanging on too long. Thirty-five years of first-class cricket and he still wanted another decade.
Beauclerk and Lambert, those all-round giants of the first quarter of the 19th century, just miss out on the top ten.
Jimmy Cook is perhaps the oddest name in the list. He was a South African who played most of his career during isolation in South Africa, but played three seasons with Somerset before retiring. He did get to play three Test matches.
Next up: all-rounders.
1 - data
2 - classification of matches
3 - filling in the gaps
4 - bowlers
5 - batsmen
6 - bowlers across eras
7 - batsmen across eras
8 - all-rounders (across eras)
9 - wicket-keepers
In this post, I do a comparison of batsmen across eras, by weighting each innings by the strength of the bowling attack. The latter is taken as the "average average" of the bowlers in an innings, weighted by the number of balls bowled by each. (You can see the results for Test matches here.) The same effects (only now for batsmen) occur here as in the weighted bowling averages in Part 6 — batsmen are rewarded for scoring runs against better bowling attacks, and batsmen in low-scoring eras are rewarded because typically the bowlers will have correspondingly low averages.
For innings where the bowlers' overs are not recorded, I've instead used the overall batting average for that season. I couldn't see an easy way of getting an unbiased estimate of the bowling strength, when we don't know who bowled. Using the season average will in general inflate the modified batting average (since typically a batsman will score more heavily against weaker attacks, but using the season average counts that as the same as scoring against a strong attack). But for the players near the top of the tables below, this is not so likely — these batsmen tend to "rise to the occasion" and perform disproportionately better against stronger bowling attacks. Nevertheless, perhaps you might want to put a mental asterisk next to players whose careers included matches from before 1855.
Also, some of the bowling averages are estimates (even where we know the overs bowled), so some of the weighted averages should only be given to one decimal place. But I'm getting lazy.
It's interesting to see a graph of the season averages:
There's a lot of noise in the early years because not many first-class matches were played (sometimes only one). The lowest-scoring season was 1831, when the average of runs off the bat (that is, excluding extras) was just 7,35. You can have a look at the scorecards for that season here.
To start our comparisons of batsmen, we look at just the 1800's. I've given the weighted runs, regular average, and (once again) two weighted averages, one with respect to 16,6 (the overall average for the 1800's) and one with respect to 24,5 (the overall average from 1801 to 2007). One is just a scaling of the other. Qualification: 2000 runs.
                                                                   wtd avg
name             start end   mat inns  no  runs  wtd runs  avg   wrt 16,6 wrt 24,5
KS Ranjitsinhji  1893  1899  291 232   28  10411 8042,8    51,03  39,43  58,19
RM Poore         1898  1899  42  47    6   2277  1584,2    55,54  38,64  57,03
F Pilch          1820  1854  213 389   30  6797  13668,9   18,93  38,08  56,20
WG Grace         1865  1899  838 1250  89  46792 43431,9   40,30  37,41  55,21
Lord F Beauclerk 1801  1825  94  172   14  4319  5890,3    27,34  37,28  55,02
W Lambert        1801  1817  62  112   5   2961  3964,3    27,67  37,05  54,68
N Wanostrocht    1830  1852  134 242   12  4392  8027,7    19,10  34,90  51,51
CG Taylor        1836  1859  122 222   11  3020  7080,2    14,31  33,56  49,52
G Parr           1844  1870  187 321   26  6116  9137,6    20,73  30,97  45,72
EH Budd          1803  1831  68  119   9   2597  3381,4    23,61  30,74  45,37
CT Studd         1879  1884  85  145   23  3928  3702,8    32,20  30,35  44,80
A Shrewsbury     1875  1899  459 654   66  20837 17552,8   35,44  29,85  44,06
J Guy            1837  1854  136 244   11  3090  6723,5    13,26  28,86  42,59
AG Steel         1877  1895  142 227   21  6184  5826,0    30,02  28,28  41,74
W Ward           1810  1845  116 210   21  3517  5341,6    18,61  28,26  41,71
EG Wenman        1825  1854  135 241   15  3088  6382,4    13,66  28,24  41,68
CB Fry           1892  1899  381 209   8   7364  5597,2    36,64  27,85  41,10
R Robinson       1801  1819  57  111   9   2039  2811,1    19,99  27,56  40,68
TW Hayward       1893  1899  671 283   26  9558  7014,5    37,19  27,29  40,28
W Gunn           1880  1899  505 716   65  21520 17612,3   33,06  27,05  39,93
Ranji's high average wasn't just because batting was getting easier towards the end of the century — even allowing for that he still comes out on top. Once again, Robert Poore's lucky, since his career went downhill after he fought in the Boer War.
Fuller Pilch was described a few years after his retirement as the best batsman ever, and he kept this tag until WG Grace came along. From the little I've read about him, he seems to be the first man to consistently get his foot to the pitch of the ball. In an era where pitches were of very low quality, smothering any turn or uneven bounce was very important.
It's worth commenting on the discrepancy between the rankings in the table (i.e., Pilch ahead of Grace) and the opinion of the time (Grace ahead of Pilch). Grace was considered a better batsman than Pilch because he could play attacking shots off a wider range of deliveries. But since Grace's innovations to batting technique spread to the other cricketers of the time, he didn't stand out as much as Pilch — scoring for most batsman improved after Grace.
It is sad that Nicholas Felix is so called, since his actual surname was Wanostrocht. He wanted to be known as Felix, but Wanostrocht is such a cool name for a cricketer that I've gone against his wishes in these tables. In addition to being an excellent batsman in a low-scoring era, he also invented a type of bowling machine.
Now let's compare batsmen in England across all eras. I was unsure as to how useful this would be — we all know of batsmen who have excellent records in domestic cricket but do terribly in Tests. But weighting runs by the strength of the bowling attack does a pretty good job in discarding that breed of batsman. Of course, it also doesn't allow for players such as Marcus Trescothick, who have mediocre county records but respectable Test numbers. Players who played in the 1800's are in bold.
                                                                   wtd avg
name             start end   mat inns  no  runs  wtd runs  avg   wrt 16,6 wrt 24,5
DG Bradman       1930  1948  92  120   18  9837  6835,1    96,44  67,01  98,90
GA Headley       1933  1954  47  74    9   4460  2897,8    68,62  44,58  65,80
KS Ranjitsinhji  1893  1920  291 473   58  23341 17015,4   56,24  41,00  60,51
VM Merchant      1936  1946  49  81    15  4130  2517,8    62,58  38,15  56,30
F Pilch          1820  1854  213 389   30  6797  13668,9   18,93  38,08  56,20
WH Ponsford      1926  1934  67  86    12  4110  2812,8    55,54  38,01  56,10
WM Woodfull      1926  1934  72  87    9   4374  2956,3    56,08  37,90  55,94
NC O'Neill       1961  1964  44  71    8   3350  2379,6    53,17  37,77  55,75
AF Kippax        1930  1934  42  55    11  2412  1648,0    54,82  37,46  55,28
DR Martyn        1991  2005  30  44    11  2549  1231,1    77,24  37,31  55,06
Lord F Beauclerk 1801  1825  94  172   14  4319  5890,3    27,34  37,28  55,02
CB Fry           1892  1921  381 635   42  30490 22042,7   51,42  37,17  54,86
W Lambert        1801  1817  62  112   5   2961  3964,3    27,67  37,05  54,68
AR Morris        1948  1953  46  66    5   3224  2249,2    52,85  36,87  54,42
J Cook           1989  1991  71  124   19  7604  3863,8    72,42  36,80  54,31
RB Simpson       1961  1966  49  84    14  3702  2574,0    52,89  36,77  54,27
W Bardsley       1909  1926  126 175   17  7866  5603,0    49,78  35,46  52,34
MEK Hussey       2001  2005  60  105   13  6710  3253,5    72,93  35,36  52,19
SR Waugh         1987  2002  75  109   28  5290  2855,4    65,31  35,25  52,03
WR Hammond       1920  1951  515 828   88  40733 26039,2   55,04  35,19  51,93
WG Grace         1865  1908  838 1428  97  52043 46760,0   39,10  35,13  51,85
N Wanostrocht    1830  1852  134 242   12  4392  8027,7    19,10  34,90  51,51
SG Barnes        1938  1948  34  46    5   2074  1417,3    50,59  34,57  51,02
DS Lehmann       1991  2006  89  139   8   8894  4525,7    67,89  34,55  50,99
AL Hassett       1938  1953  73  100   11  4684  3063,3    52,63  34,42  50,80
CL Walcott       1950  1957  49  78    12  3271  2268,0    49,56  34,36  50,72
WM Lawry         1961  1968  65  105   12  4590  3182,2    49,35  34,22  50,50
G Boycott        1962  1986  492 814   127 38981 23425,2   56,74  34,10  50,33
JB Hobbs         1905  1934  740 1178  98  53843 36714,9   49,85  34,00  50,17
L Hutton         1934  1960  425 676   75  32306 20354,7   53,75  33,87  49,99
The top spot should be pretty uncontroversial. Vijay Merchant is at number four — he is perhaps not famous enough for having the second-highest first-class average of all time (71,64). Pilch slots in at five, followed by a string of Australians. You'll note that WG Grace fell significantly in the years between 1899 and his retirement in 1908. It's that old story of a player hanging on too long. Thirty-five years of first-class cricket and he still wanted another decade.
Beauclerk and Lambert, those all-round giants of the first quarter of the 19th century, just miss out on the top ten.
Jimmy Cook is perhaps the oddest name in the list. He was a South African who played most of his career during isolation in South Africa, but played three seasons with Somerset before retiring. He did get to play three Test matches.
Next up: all-rounders.
Thursday, February 07, 2008
Increasing or decreasing scores
Imagine a scorecard in which each batsman's score is less than the previous one. So, for example, the first opener scores 131, the second 82, the number three makes 75, the number four makes 56, and so on. What would you guess is the longest such sequence of declining scores in a Test innings? What would you guess is the longest increasing sequence?
These are, I admit, not the most important questions in cricket, but I found them fun. I would have thought that, while a long decreasing sequence would be rare, once you hit number 7 and the tail it should common enough to get down to number eight or nine. The problem is that once a batsman makes a duck, the sequence has to stop, so it'd be pretty unlikely to get all the way to number eleven.
An increasing sequence should be rarer, but perhaps when a captain reversed his batting order on a sticky wicket, you could get a sequence up to seven or so. Certainly I thought the longest increasing sequence would be shorter than the longest decreasing sequence.
As it happens, the longest increasing sequence goes to number six, but so does the longest decreasing sequence!
Decreasing sequences: Eng v Aus, 1905, Eng v SA, 1955, Aus v Eng, 1990/1, Zim v NZ, 1992/3.
Increasing sequences: Aus v Eng, 1884/5, Aus v Eng, 1932/3, Eng v WI, 1957.
If you allow a score to be equal to the previous score, the longest non-decreasing sequences still only go down to number six, but there are two non-increasing sequences to number 7: SA v Aus, 1949/50, Eng v Aus, 1977.
What about first-class matches? I only have a database of matches played in England (which is about 28000, more than half ever played), but the largest sequences (not allowing equal scores) in this dataset are of length eight:
Decreasing: Lancs v Middlesex, 1913, Lancs v Glamorgan, 1928, Wales v Minor Counties, 1930, Yorks v Lancs, 1952, Kent v Surrey, 1988.
Increasing: Lancs v Kent, 1988.
The Kent v Surrey innings (Surrey's first) is actually non-increasing right the way down to number eleven (it finishes with three ducks and a nought not out). There are two other cases of non-increasing sequences from one to eleven: Yorks v Lancs, 1888 (finishes with five ducks and a nought not out), Gloucs v Leics, 1929.
The longest non-decreasing sequence is still eight.
Is there a way we could have guessed how rare these sequences are? Any maths-phobes may wish to stop reading now. There's some calculus below.
A naïve approach would be to say that, since each score is either higher or lower than the previous one, it's just like flipping a coin. (Not exactly: it could be equal, but it'd be pretty close.) What's the probability of getting seven heads in a row? One in 128. But there have been over 1800 Test matches, so sequences of length seven should have occurred dozens of times!
The error in the above reasoning is at the start: it's not like flipping a coin. The first step is (the second opener could be higher or lower than the first, with a close to 50% chance each way), but after that, it's no longer 50-50. Suppose the first opener makes 40. It might be 50-50 as to whether the second opener scores less than 40. He might make 30, say. But then the probability that the number three will score less than 30 is less than 50%. If he makes 20, the chance that the number four will make less than this is even smaller than the previous probability, and so on.
A better way would be to assume that individual innings follow an exponential distribution, which says that scores of 0 are more common than scores of 1, which are more common than scores of 2, etc. (This isn't real distribution — in reality it's quite skewed towards zero — but it's a reasonable approximation for these fun purposes. Also, the runs are scored in discrete units — 1, 2, 3, etc. — but the exponential distribution allows for any positive real number of runs, such as sqrt(2) or 4.9.) Assume further (to make the maths easier) that each batsman has the same average.
The probability that a batsman with average 1/k makes a score less than x is given by:
Sorry for the ugly formatting. That's the integral from 0 to x of k*exp(-k*s) with respect to s.
Now let the first n batsman's scores be called s1, s2, ..., s(n-1), sn. We want the probability P that the sequence goes s1 > s2 > ... s(n-1) > sn. To start, we use (*) on the last link in the chain of inequalities:
Once we have that, we carry that on to the next inequality, and so on, until we have all of them. The last integral is from 0 to infinity, since the first score s1 can be anything:
Now we evaluate these integrals! Trust me when I say that, when you expand it all out, most of the terms cancel, and you're left with a term that comes from integrating the exponentials which multiply together, so that the probability is 1/n!.
So, a decreasing sequence of length six should happen about once every 720 innings, a sequence of length seven about once every 5040 innings, and a sequence of length 8 about once every 40320 innings.
Essentially the same argument gives the same probabilities for increasing sequences.
It's not perfect (and we wouldn't expect it to be so, given that the real distribution isn't exponential, and batsmen's averages aren't all equal), but it gets the right order of magnitude at least. It gives us a good idea of why we haven't seen a sequence of length seven in Test cricket yet, though we should get one eventually, perhaps in the next ten or twenty years.
These are, I admit, not the most important questions in cricket, but I found them fun. I would have thought that, while a long decreasing sequence would be rare, once you hit number 7 and the tail it should common enough to get down to number eight or nine. The problem is that once a batsman makes a duck, the sequence has to stop, so it'd be pretty unlikely to get all the way to number eleven.
An increasing sequence should be rarer, but perhaps when a captain reversed his batting order on a sticky wicket, you could get a sequence up to seven or so. Certainly I thought the longest increasing sequence would be shorter than the longest decreasing sequence.
As it happens, the longest increasing sequence goes to number six, but so does the longest decreasing sequence!
Decreasing sequences: Eng v Aus, 1905, Eng v SA, 1955, Aus v Eng, 1990/1, Zim v NZ, 1992/3.
Increasing sequences: Aus v Eng, 1884/5, Aus v Eng, 1932/3, Eng v WI, 1957.
If you allow a score to be equal to the previous score, the longest non-decreasing sequences still only go down to number six, but there are two non-increasing sequences to number 7: SA v Aus, 1949/50, Eng v Aus, 1977.
What about first-class matches? I only have a database of matches played in England (which is about 28000, more than half ever played), but the largest sequences (not allowing equal scores) in this dataset are of length eight:
Decreasing: Lancs v Middlesex, 1913, Lancs v Glamorgan, 1928, Wales v Minor Counties, 1930, Yorks v Lancs, 1952, Kent v Surrey, 1988.
Increasing: Lancs v Kent, 1988.
The Kent v Surrey innings (Surrey's first) is actually non-increasing right the way down to number eleven (it finishes with three ducks and a nought not out). There are two other cases of non-increasing sequences from one to eleven: Yorks v Lancs, 1888 (finishes with five ducks and a nought not out), Gloucs v Leics, 1929.
The longest non-decreasing sequence is still eight.
Is there a way we could have guessed how rare these sequences are? Any maths-phobes may wish to stop reading now. There's some calculus below.
A naïve approach would be to say that, since each score is either higher or lower than the previous one, it's just like flipping a coin. (Not exactly: it could be equal, but it'd be pretty close.) What's the probability of getting seven heads in a row? One in 128. But there have been over 1800 Test matches, so sequences of length seven should have occurred dozens of times!
The error in the above reasoning is at the start: it's not like flipping a coin. The first step is (the second opener could be higher or lower than the first, with a close to 50% chance each way), but after that, it's no longer 50-50. Suppose the first opener makes 40. It might be 50-50 as to whether the second opener scores less than 40. He might make 30, say. But then the probability that the number three will score less than 30 is less than 50%. If he makes 20, the chance that the number four will make less than this is even smaller than the previous probability, and so on.
A better way would be to assume that individual innings follow an exponential distribution, which says that scores of 0 are more common than scores of 1, which are more common than scores of 2, etc. (This isn't real distribution — in reality it's quite skewed towards zero — but it's a reasonable approximation for these fun purposes. Also, the runs are scored in discrete units — 1, 2, 3, etc. — but the exponential distribution allows for any positive real number of runs, such as sqrt(2) or 4.9.) Assume further (to make the maths easier) that each batsman has the same average.
The probability that a batsman with average 1/k makes a score less than x is given by:
x
/
| ds k*exp(-k*s)             (*)
/
0
Sorry for the ugly formatting. That's the integral from 0 to x of k*exp(-k*s) with respect to s.
Now let the first n batsman's scores be called s1, s2, ..., s(n-1), sn. We want the probability P that the sequence goes s1 > s2 > ... s(n-1) > sn. To start, we use (*) on the last link in the chain of inequalities:
s(n-1)
/
| dsn k*exp(-k*sn)
/
0
Once we have that, we carry that on to the next inequality, and so on, until we have all of them. The last integral is from 0 to infinity, since the first score s1 can be anything:
oo                 s1                     s(n-1)
/                  /                      /
| ds1 k*exp(-k*s1) | ds2 k*exp(-k*s2) ... | dsn k*exp(-k*sn)
/                  /                      /
0                  0                      0
Now we evaluate these integrals! Trust me when I say that, when you expand it all out, most of the terms cancel, and you're left with a term that comes from integrating the exponentials which multiply together, so that the probability is 1/n!.
So, a decreasing sequence of length six should happen about once every 720 innings, a sequence of length seven about once every 5040 innings, and a sequence of length 8 about once every 40320 innings.
Essentially the same argument gives the same probabilities for increasing sequences.
It's not perfect (and we wouldn't expect it to be so, given that the real distribution isn't exponential, and batsmen's averages aren't all equal), but it gets the right order of magnitude at least. It gives us a good idea of why we haven't seen a sequence of length seven in Test cricket yet, though we should get one eventually, perhaps in the next ten or twenty years.
Tuesday, February 05, 2008
1800's first-class cricket in England: bowlers across eras
This is Part 6 in my series on first-class cricket in the 1800's in England.
1 - data
2 - classification of matches
3 - filling in the gaps
4 - bowlers
5 - batsmen
6 - bowlers across eras
7 - batsmen across eras
8 - all-rounders (across eras)
9 - wicket-keepers
In this post, I do a comparison of bowlers across eras, by weighting each wicket that a bowler takes by the batting average of the batsman dismissed. (You can see the results for Test matches here.) This has two effects. The first is that bowlers who dismiss the best batsmen are rewarded for doing so (and bowlers who just pick up tailenders are punished). The second is that, since in an era of low scoring, most batsmen will have proportionally lower averages (and vice versa), the resulting weighted averages will be comparable across eras.
For scorecards where the caught etc. wickets are estimated rather than known, each "fractional wicket" is weighted by the batting average times the fraction. For these scorecards, the bowler will still be rewarded for bowling the best batsmen, but after that, he is simply rewarded for doing well against teams with good batsmen who he might have dismissed.
In each of the tables below, I give the wickets, weighted wickets, runs conceded, the usual average, and then two resulting weighted averages (one being just a scaling of the other). One is with respect to 16,6 (the overall average for the 1800's), and one is with respect to 24,1 (the overall average from 1801 to 2007).
First up, the top bowlers from the 1800's, as ordered by the weighted average. Qualification: 200 wickets.
Australians take places one and two! It's always good to pass such sanity checks. Charlie Turner and Ernie Jones have remarkably similar weighted averages — they only diverge at the fourth decimal place. (On a slightly more serious note: we would expect that international bowlers come near the top of these tables, since they are Test-class bowlers, and should generally be as good as the best English bowlers.)
It's also good to see that this analysis puts Tom Richardson as the top Englishmen of the 1800's. He was considered the best fast bowler of all time at his peak, which lasted from 1893 to 1897. A young Wilfred Rhodes gets into fourth spot, based on his spectacular first two seasons of county cricket.
The absence of bowlers from the first part of the century is explained by there not being many matches played. Only a handful of players played a decent number of matches (that is, enough to reach 200 wickets), and most of these were batsmen or all-rounders.
That James Broadbridge, James Cobbett et al. are missing from the top of the table is more of a surprise. It seems that, while the round-arm era saw the lowest scoring in first-class history, none of the bowlers really stood out. They had spectacular averages, but so did everyone else at the time. (It is also possible that some of the bowlers would be higher if the wickets were known — perhaps some dismissed more top-order batsmen than the estimations give them). Broadbridge is 49th, with a weighted average of 14,2 with respect to 16,6. Alfred Mynn is a long way down the table (94th; weighted average 15,9 wrt 16,6).
Now let us move on to the comparison for all time. Players whose first-class careers started in the 1800's are in bold.
A good cross-section of eras and countries is represented, with Murali leading the pack. Hedley Verity is, suprisingly enough, the top English bowler, and George Freeman sneaks into the top 20. It is curious that SF Barnes is so far down the list (number 21). When I did this exercise for Test bowlers, he was the best for anyone with 100 wickets.
In amongst international stars, there are a couple of surprising names. Bob Appleyard, who bowled both off-breaks and fast-medium, is the first of these. He may well have become a great of the game had it not been for a terrible run of illness (including being diagnosed with TB) and injury. His rise for Yorkshire was spectacular, as he took 200 wickets in his first full season. But after just nine Tests (in which he took 31 wickets at under 18), his fall was just as spectacular.
Douglas Carr played just one Test for England in 1909. His career ended with the outbreak of war, but it surprises me that he didn't get any more Tests.
Les Jackson was also unlucky, being selected only twice for England. In an era when England had less pacemen, he probably would have played more international cricket.
Big Jim Smith is best remembered for his slogging (he once hit a half-century in eleven minutes), but his numbers suggest that he could have done well as a Test bowler. As it is, he got just five Tests, taking 15 wickets at 26,2. I suppose that if he had played some Tests against Bradman, his figures might not look so good.
Next up: cross-era comparisons of batsmen.
1 - data
2 - classification of matches
3 - filling in the gaps
4 - bowlers
5 - batsmen
6 - bowlers across eras
7 - batsmen across eras
8 - all-rounders (across eras)
9 - wicket-keepers
In this post, I do a comparison of bowlers across eras, by weighting each wicket that a bowler takes by the batting average of the batsman dismissed. (You can see the results for Test matches here.) This has two effects. The first is that bowlers who dismiss the best batsmen are rewarded for doing so (and bowlers who just pick up tailenders are punished). The second is that, since in an era of low scoring, most batsmen will have proportionally lower averages (and vice versa), the resulting weighted averages will be comparable across eras.
For scorecards where the caught etc. wickets are estimated rather than known, each "fractional wicket" is weighted by the batting average times the fraction. For these scorecards, the bowler will still be rewarded for bowling the best batsmen, but after that, he is simply rewarded for doing well against teams with good batsmen who he might have dismissed.
In each of the tables below, I give the wickets, weighted wickets, runs conceded, the usual average, and then two resulting weighted averages (one being just a scaling of the other). One is with respect to 16,6 (the overall average for the 1800's), and one is with respect to 24,1 (the overall average from 1801 to 2007).
First up, the top bowlers from the 1800's, as ordered by the weighted average. Qualification: 200 wickets.
                                wtd                     wtd avg
name          start end   wkts  wkts    runs    avg   wrt 16,6 wrt 24,1
CTB Turner    1888  1893  610   805,2   7869    12,90  9,77   14,19
E Jones       1896  1899  256   490,0   4789    18,71  9,77   14,19
T Richardson  1892  1899  1455  2183,6  22980   15,79  10,52  15,28
W Rhodes      1898  1899  333   495,0   5311    15,95  10,73  15,58
JT Hearne     1888  1899  1635  2406,6  25986   15,89  10,80  15,68
W Mead        1892  1899  746   1229,8  13500   18,10  10,98  15,94
GA Lohmann    1884  1896  1590  1963,4  21968   13,82  11,19  16,24
AE Trott      1896  1899  453   715,7   8102    17,89  11,32  16,43
G Freeman     1865  1880  288   250,2   2849,2  9,9    11,4   16,5  +/- 0,2%
FR Spofforth  1878  1897  675   807,9   9204    13,64  11,39  16,54
W Attewell    1881  1899  1809  2453,7  27955   15,45  11,39  16,54
AW Mold       1889  1899  1486  1980,2  23044   15,51  11,64  16,89
H Trumble     1890  1899  450   676,9   7883    17,52  11,65  16,91
HF Boyle      1878  1890  259   299,8   3600    13,90  12,01  17,44
A Shaw        1864  1897  1881  1912,0  23108,4 12,29  12,09  17,55 +/- 0,01%
WH Lockwood   1886  1899  902   1277,2  15484   17,17  12,12  17,60
S Haigh       1895  1899  364   552,2   6722    18,47  12,17  17,67
WR Cuttell    1896  1899  324   523,6   6419    19,81  12,26  17,80
J Briggs      1879  1899  1907  2386,0  29384   15,41  12,32  17,88
AW Hallam     1895  1899  207   322,8   3995    19,30  12,37  17,96
Australians take places one and two! It's always good to pass such sanity checks. Charlie Turner and Ernie Jones have remarkably similar weighted averages — they only diverge at the fourth decimal place. (On a slightly more serious note: we would expect that international bowlers come near the top of these tables, since they are Test-class bowlers, and should generally be as good as the best English bowlers.)
It's also good to see that this analysis puts Tom Richardson as the top Englishmen of the 1800's. He was considered the best fast bowler of all time at his peak, which lasted from 1893 to 1897. A young Wilfred Rhodes gets into fourth spot, based on his spectacular first two seasons of county cricket.
The absence of bowlers from the first part of the century is explained by there not being many matches played. Only a handful of players played a decent number of matches (that is, enough to reach 200 wickets), and most of these were batsmen or all-rounders.
That James Broadbridge, James Cobbett et al. are missing from the top of the table is more of a surprise. It seems that, while the round-arm era saw the lowest scoring in first-class history, none of the bowlers really stood out. They had spectacular averages, but so did everyone else at the time. (It is also possible that some of the bowlers would be higher if the wickets were known — perhaps some dismissed more top-order batsmen than the estimations give them). Broadbridge is 49th, with a weighted average of 14,2 with respect to 16,6. Alfred Mynn is a long way down the table (94th; weighted average 15,9 wrt 16,6).
Now let us move on to the comparison for all time. Players whose first-class careers started in the 1800's are in bold.
                                wtd                     wtd avg
name          start end   wkts  wkts    runs    avg   wrt 16,6 wrt 24,1
M Muralidaran 1991  2007  306   556,4   5163    16,87  9,28   13,47
RR Lindwall   1948  1956  218   385,0   3667    16,82  9,53   13,83
RJ Hadlee     1973  1990  780   1327,1  12707   16,29  9,57   13,90
WJ O'Reilly   1934  1938  213   367,9   3584    16,83  9,74   14,14
H Verity      1930  1939  1732  2534,0  24816   14,33  9,79   14,22
J Garner      1977  1986  426   728,4   7428    17,44  10,20  14,81
CTB Turner    1888  1893  610   764,4   7869    12,90  10,29  14,95
WE Bowes      1928  1947  1591  2533,9  26201   16,47  10,34  15,01
MD Marshall   1979  1994  994   1773,1  18369   18,48  10,36  15,04
JB Statham    1950  1968  1999  3007,7  31533   15,77  10,48  15,22
R Appleyard   1950  1958  664   979,1   10309   15,53  10,53  15,29
CEL Ambrose   1988  2000  447   852,8   9301    20,81  10,91  15,83
CV Grimmett   1926  1934  358   587,0   6441    17,99  10,97  15,93
TM Alderman   1981  1989  370   679,7   7477    20,21  11,00  15,97
IR Bishop     1988  1995  225   417,7   4609    20,48  11,03  16,02
WW Armstrong  1902  1921  407   620,5   6880    16,90  11,09  16,10
ST Clarke     1979  1988  591   1009,3  11226   18,99  11,12  16,15
DW Carr       1909  1914  334   499,8   5585    16,72  11,17  16,22
H Larwood     1924  1938  1336  2023,9  22766   17,04  11,25  16,33
G Freeman     1865  1880  288   249,9   2849,2  9,9    11,4   16,6  +/- 0,2%
SF Barnes     1894  1930  461   708,2   8080    17,53  11,41  16,56
S Ramadhin    1950  1965  399   581,2   6662    16,70  11,46  16,64
Waqar Younis  1990  2003  436   801,7   9251    21,22  11,54  16,75
CA Walsh      1984  2000  1013  1839,4  21241   20,97  11,55  16,76
FR Spofforth  1878  1897  675   792,1   9204    13,64  11,62  16,87
H Trumble     1890  1902  587   837,8   9804    16,70  11,70  16,99
HL Jackson    1947  1963  1730  2557,9  30066   17,38  11,75  17,06
CIJ Smith     1930  1939  824   1322,9  15565   18,89  11,77  17,08
GA Faulkner   1907  1924  267   374,7   4423    16,57  11,80  17,14
W Rhodes      1898  1930  3960  5489,5  64836   16,37  11,81  17,15
A good cross-section of eras and countries is represented, with Murali leading the pack. Hedley Verity is, suprisingly enough, the top English bowler, and George Freeman sneaks into the top 20. It is curious that SF Barnes is so far down the list (number 21). When I did this exercise for Test bowlers, he was the best for anyone with 100 wickets.
In amongst international stars, there are a couple of surprising names. Bob Appleyard, who bowled both off-breaks and fast-medium, is the first of these. He may well have become a great of the game had it not been for a terrible run of illness (including being diagnosed with TB) and injury. His rise for Yorkshire was spectacular, as he took 200 wickets in his first full season. But after just nine Tests (in which he took 31 wickets at under 18), his fall was just as spectacular.
Douglas Carr played just one Test for England in 1909. His career ended with the outbreak of war, but it surprises me that he didn't get any more Tests.
Les Jackson was also unlucky, being selected only twice for England. In an era when England had less pacemen, he probably would have played more international cricket.
Big Jim Smith is best remembered for his slogging (he once hit a half-century in eleven minutes), but his numbers suggest that he could have done well as a Test bowler. As it is, he got just five Tests, taking 15 wickets at 26,2. I suppose that if he had played some Tests against Bradman, his figures might not look so good.
Next up: cross-era comparisons of batsmen.
Sunday, February 03, 2008
1800's first-class cricket in England: batsmen
This is Part 5 in my series on cricket in the 1800's in England.
1 - data
2 - classification of matches
3 - filling in the gaps
4 - bowlers
5 - batsmen
6 - bowlers across eras
7 - batsmen across eras
8 - all-rounders (across eras)
9 - wicket-keepers
(Edit: I've fixed a number of typos in the tables. The runs and averages were correct, but somehow the innings and not-outs had got all mixed up.)
This post is nothing statistically special — just a few lists of batsmen. Batting data for first-class cricket is essentially complete, so there's no need for fancy estimation techniques for calculating averages etc.
The leading batting averages for the 1800's come exclusively from players who played near the end of the century, when batting became easier. Qualification (for all tables in this post): 2000 runs.
Robert Poore's pretty lucky that I stopped at 1899. In his last season of cricket before fighting in the Boer War, he scored a triple century and averaged over 90. When he returned to first-class cricket in 1902, he did not return to those heights, and his first-class career finished with an average under 40. Ranjitsinhji, on the other hand, was able to sustain his average, and indeed it finished over 56 (with a Test average in the mid-40's as well).
Joe Darling is the first Australian to make any of these lists. His presence arises from his scores in the Australian tours of England in 1896 and 1899.
Now let's look at the leading batsmen by runs scored.
We see that WG Grace, as well as taking comfortably more wickets than anyone else, scored more than twice as many first-class runs in England than any other batsman in the 1800's! Of course, he did play many more matches (second on that list is George Ulyett with 499), but you can see how he was such a giant of the game, and why he remains famous to this day.
Henry Jupp, who represented England in the first two Test matches, is the only player in that table to have ended his career before 1890. Here are some other players to have passed 2000 runs, ordered by the start season of their careers:
Beauclerk and Lambert we met in Part 4. Billy Beldham (whose photograph you can see here) perhaps played his best cricket in the late 18th century, in matches that are not classified as first-class. He is credited with being a founder of what might be called proto-modern batting technique. Batting has evolved a long way since then! While Beldham and his contemporaries stepped forward to meet the ball, it would take about another half-century before batsmen played attacking strokes off either the front foot or the back, and strokes off the pads were developed by Ranji late close to 1900.
Robert Robinson is a rather anonymous figure as far as the Internet is concerned. I haven't managed to find much out about him, despite him having been one of the leading batsmen of the day. He also played in the 18th century, and scored a century in his first important match for which CricketArchive has a full scorecard (Kent v Hampshire, 1792).
Next up: Adjusting bowling averages for era and the quality of wickets taken.
1 - data
2 - classification of matches
3 - filling in the gaps
4 - bowlers
5 - batsmen
6 - bowlers across eras
7 - batsmen across eras
8 - all-rounders (across eras)
9 - wicket-keepers
(Edit: I've fixed a number of typos in the tables. The runs and averages were correct, but somehow the innings and not-outs had got all mixed up.)
This post is nothing statistically special — just a few lists of batsmen. Batting data for first-class cricket is essentially complete, so there's no need for fancy estimation techniques for calculating averages etc.
The leading batting averages for the 1800's come exclusively from players who played near the end of the century, when batting became easier. Qualification (for all tables in this post): 2000 runs.
name            start end   mat  inns  no  runs  avg     wkts   runs  avg     +/- %
RM Poore        1898  1899  26   47    6   2277  55,54   0      13    0,00    0
KS Ranjitsinhji 1893  1899  128  232   28  10411 51,03   67     2340  34,93   0
WG Grace        1865  1899  732  1250  89  46792 40,30   2495   43960 17,62   0
WG Quaife       1894  1899  120  203   39  6122  37,33   55     1792  32,58   0
TW Hayward      1893  1899  191  283   26  9558  37,19   364    7367  20,24   0
CJ Burnup       1895  1899  77   137   12  4633  37,06   22     855   38,86   0
PA Perrin       1896  1899  76   131   13  4336  36,75   2      109   54,50   0
CB Fry          1892  1899  114  209   8   7364  36,64   149    4046  27,15   0
A Shrewsbury    1875  1899  400  654   66  20837 35,44   0      2     0,00    0
J Darling       1896  1899  67   109   10  3496  35,31   1      38    38,00   0
Robert Poore's pretty lucky that I stopped at 1899. In his last season of cricket before fighting in the Boer War, he scored a triple century and averaged over 90. When he returned to first-class cricket in 1902, he did not return to those heights, and his first-class career finished with an average under 40. Ranjitsinhji, on the other hand, was able to sustain his average, and indeed it finished over 56 (with a Test average in the mid-40's as well).
Joe Darling is the first Australian to make any of these lists. His presence arises from his scores in the Australian tours of England in 1896 and 1899.
Now let's look at the leading batsmen by runs scored.
name            start end   mat  inns  no  runs  avg     wkts   runs  avg     +/- %
WG Grace        1865  1899  732  1250  89  46792 40,30   2495   43960 17,62   0
R Abel          1881  1899  468  743   48  22846 32,87   246    5644  22,94   0
W Gunn          1880  1899  437  716   65  21520 33,06   74     1660  22,43   0
WW Read         1873  1897  450  723   50  21408 31,81   101    3339  33,06   0
A Shrewsbury    1875  1899  400  654   66  20837 35,44   0      2     0       0
G Ulyett        1873  1893  499  862   39  19031 23,12   598    11765 19,67   0
AN Hornby       1867  1899  422  687   41  15752 24,38   7      179   25,57   0
H Jupp          1862  1881  375  686   48  15244 23,89   7      316   45,14   0
W Barnes        1875  1894  421  666   54  14108 23,05   803    13935 17,35   0
AE Stoddart     1885  1899  255  449   54  13799 31,72   206    5553  26,96   0
We see that WG Grace, as well as taking comfortably more wickets than anyone else, scored more than twice as many first-class runs in England than any other batsman in the 1800's! Of course, he did play many more matches (second on that list is George Ulyett with 499), but you can see how he was such a giant of the game, and why he remains famous to this day.
Henry Jupp, who represented England in the first two Test matches, is the only player in that table to have ended his career before 1890. Here are some other players to have passed 2000 runs, ordered by the start season of their careers:
name             start end   mat inns  no  runs  avg     wkts   runs    avg   +/- %
Lord F Beauclerk 1801  1825  94  172   14  4319  27,34   406,4  5106,9  12,6  10
W Lambert        1801  1817  62  112   5   2961  27,67   318,1  3960,3  12,5  10
W Beldham        1801  1821  69  127   7   2265  18,88   96,0   1193,0  12,4  10
R Robinson       1801  1819  57  111   9   2039  19,99   34,7   802,4   23,1  10
EH Budd          1803  1831  68  119   9   2597  23,61   285,8  4200,8  14,7  10
W Ward           1810  1845  116 210   21  3517  18,61   73,0   1511,4  20,7  10
J Broadbridge    1814  1840  90  163   21  2368  16,68   405,6  3699,7  9,1   9,9
F Pilch          1820  1854  213 389   30  6797  18,93   169,5  1666,3  9,8   9,4
EG Wenman        1825  1854  135 241   15  3088  13,66   62,2   485,7   7,8   10
FW Lillywhite    1825  1851  220 390   84  2203  7,20    1599,8 14181,1 8,9   8,5
Beauclerk and Lambert we met in Part 4. Billy Beldham (whose photograph you can see here) perhaps played his best cricket in the late 18th century, in matches that are not classified as first-class. He is credited with being a founder of what might be called proto-modern batting technique. Batting has evolved a long way since then! While Beldham and his contemporaries stepped forward to meet the ball, it would take about another half-century before batsmen played attacking strokes off either the front foot or the back, and strokes off the pads were developed by Ranji late close to 1900.
Robert Robinson is a rather anonymous figure as far as the Internet is concerned. I haven't managed to find much out about him, despite him having been one of the leading batsmen of the day. He also played in the 18th century, and scored a century in his first important match for which CricketArchive has a full scorecard (Kent v Hampshire, 1792).
Next up: Adjusting bowling averages for era and the quality of wickets taken.
![]()
Subscribe to Posts [Atom]